
Why Jira Reports Matter
Jira reports provide crucial insights into your team's progress, productivity, and bottlenecks. They help Agile teams measure performance, refine workflows, and optimize sprint planning. In this guide, we’ll explore the most useful Jira reports, their benefits, and how Scoper enhances Jira’s reporting capabilities.
Essential Jira Reports and Their Use Cases
1. Sprint Report
- Tracks sprint progress, including completed, in-progress, and incomplete issues.
- Helps teams analyze sprint performance and identify trends in workload completion.
- Ideal for retrospective meetings to refine future sprint planning.
2. Burndown Chart
- Displays remaining work over time, helping teams gauge sprint progress.
- Enables project managers to identify scope creep and adjust priorities.
- Essential for tracking whether teams are on target to meet sprint goals.
3. Velocity Chart
- Shows the average work completed per sprint based on past data.
- Helps teams set realistic sprint goals based on historical performance.
- Useful for predicting future sprint capacity.
4. Cumulative Flow Diagram (CFD)
- Visualizes work in different stages (To Do, In Progress, Done) over time.
- Helps teams identify bottlenecks and workflow inefficiencies.
- Great for Kanban teams to ensure steady workflow distribution.
5. Control Chart
- Analyzes cycle time (how long it takes for tasks to be completed).
- Provides insights into team efficiency and process consistency.
- Useful for tracking deviations in task completion times.
6. Lead Time and Cycle Time Reports
- Lead Time: Measures the time from issue creation to completion.
- Cycle Time: Tracks how long issues remain in the ‘In Progress’ phase.
- Helps teams optimize work processes by identifying delays.
7. Time Tracking Report
- Summarizes the total time spent on tasks vs. original estimates.
- Useful for assessing estimation accuracy and team productivity.
- Helps managers identify where time is being over- or under-utilized.
8. Created vs. Resolved Issues Report
- Compares the number of issues created vs. completed over time.
- Helps teams measure backlog growth and identify workload trends.
- Useful for tracking whether teams are keeping up with incoming work.
9. Pie Chart Report
- Displays issue breakdowns by category (e.g., assignee, status, priority).
- Provides a quick visual representation of project data.
- Helps managers identify workload distribution and issue resolution rates.
10. Custom Reports
- Jira allows custom dashboards and reports to be created based on specific team needs.
- Filters and JQL (Jira Query Language) can refine report insights.
- Useful for teams with unique reporting requirements.
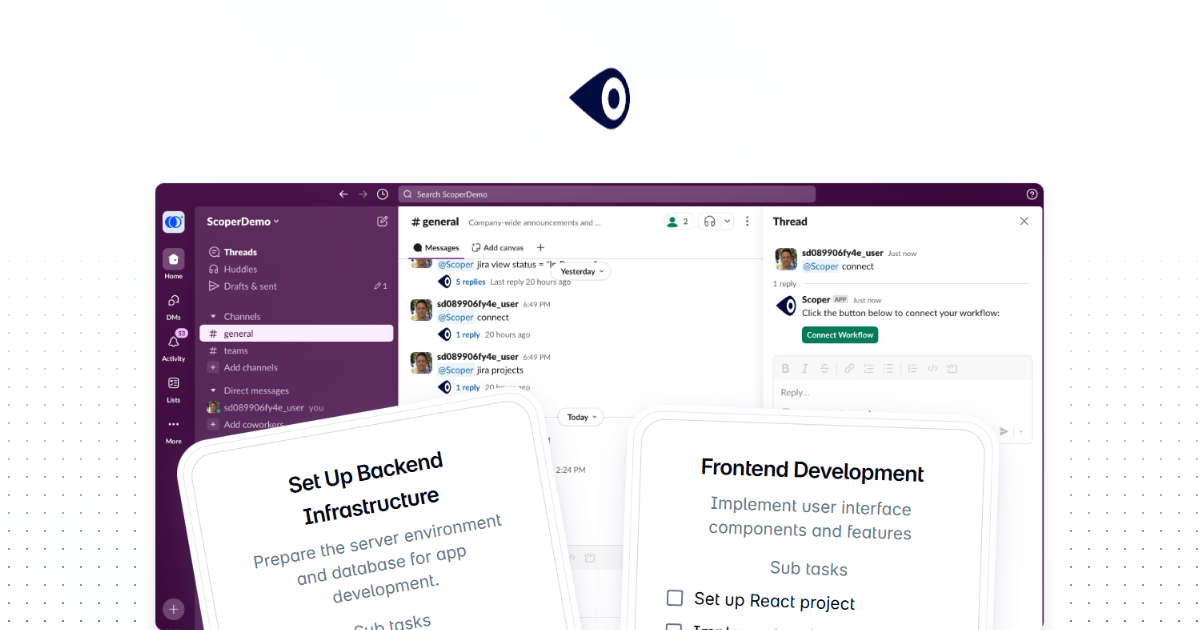
How Scoper Enhances Jira Reports
While Jira provides detailed reporting, Scoper integrates with Jira and Slack to deliver AI-powered insights that make reports more actionable:
- Automated Slack updates on key report metrics.
- AI-powered anomaly detection to highlight unexpected trends.
- Historical trend analysis for better forecasting and decision-making.
Conclusion
Jira reports are vital for tracking project health, optimizing workflows, and improving team efficiency. By leveraging Scoper’s AI-powered insights, teams can move beyond static reports and receive proactive recommendations that enhance Agile performance.
Get Started with Scoper Today
Want to unlock smarter reporting in Jira? Try Scoper and let AI-powered insights help you track and optimize project performance. Sign up today to transform the way your team works.